There may be instances where a domain you’re visiting does not render correctly. Maybe the images are blank, or you’re having an issue logging into a website. There are a number of things that could be contributing to this, and while DNS could be an issue it could also be something completely unrelated.
To help diagnose the problem, we will leverage something known as Developer Tools. Almost every browser has it built into their browser. In the example below I will use the Chrome Developer Tools.
Step 1: Accessing Browser Developer Tools
While all browsers can be a bit unique, accessing Dev Tools usually follows a similar workflow.
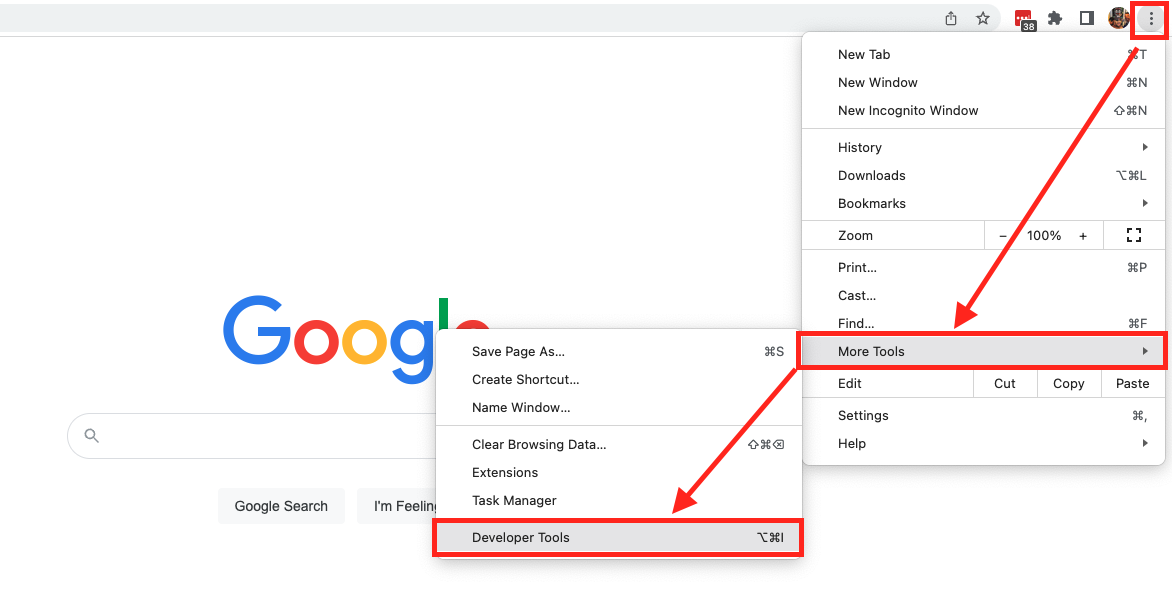
In Chrome, you navigate to browser settings > More Tools > Developer tools. The image below shows you where it is located:

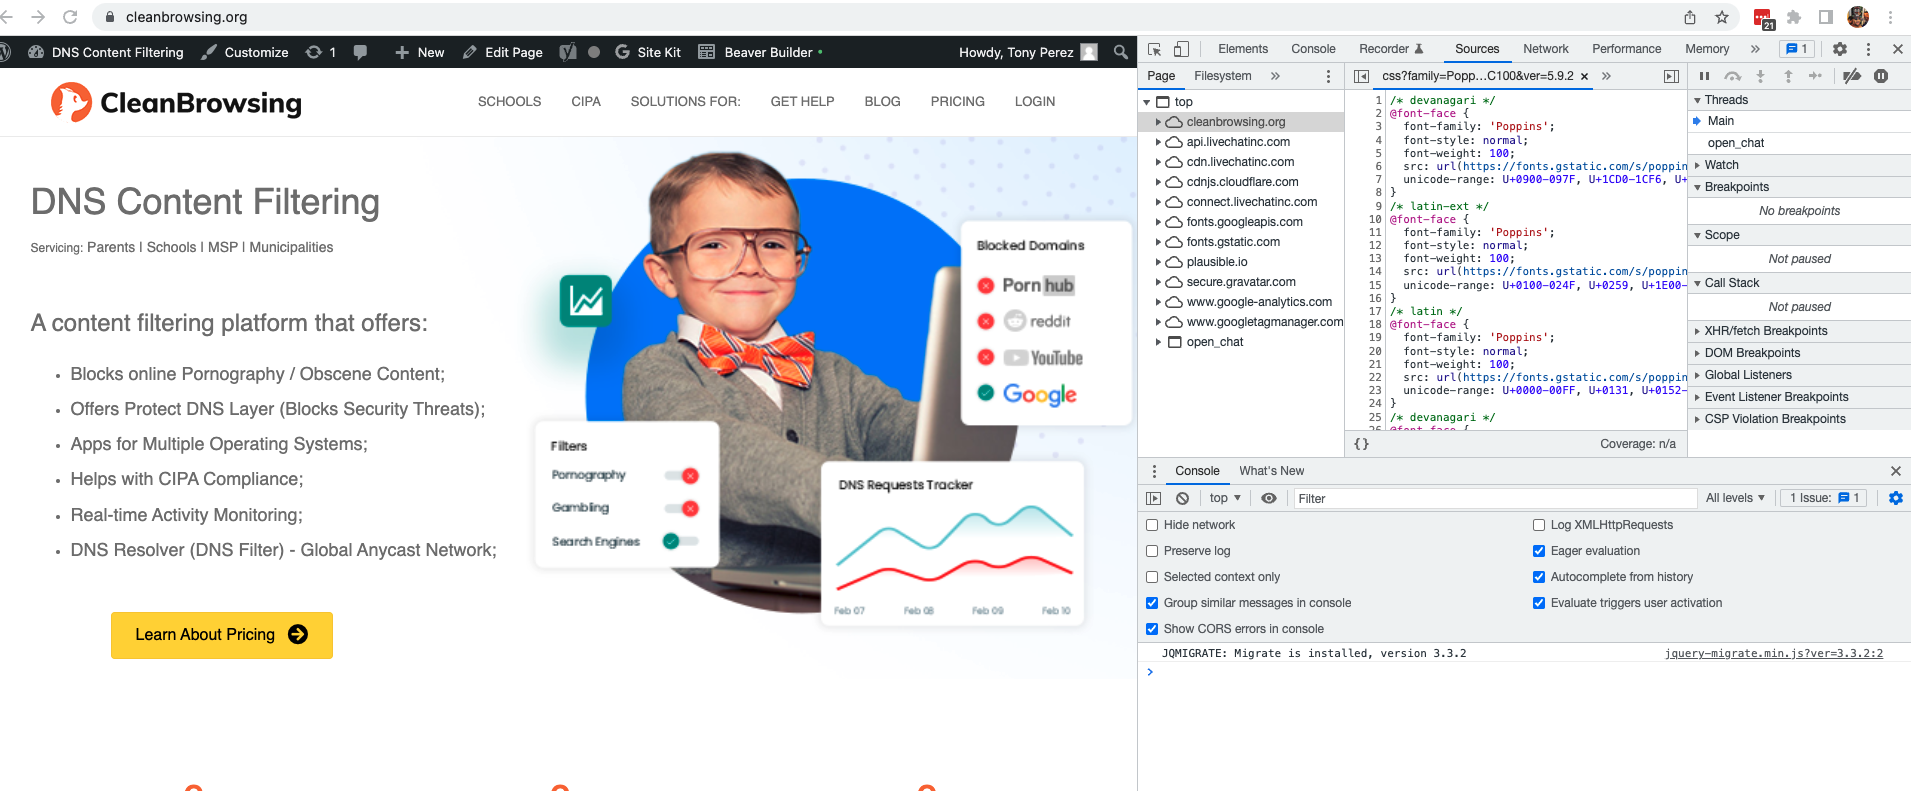
When it opens, it will look like this:

The new pane on the right is where you will find additional information. A lot of developers use this to troubleshoot issues with their code, and network administrators can use it to understand what might not be loading.
Step 2: Find Blocked Sources
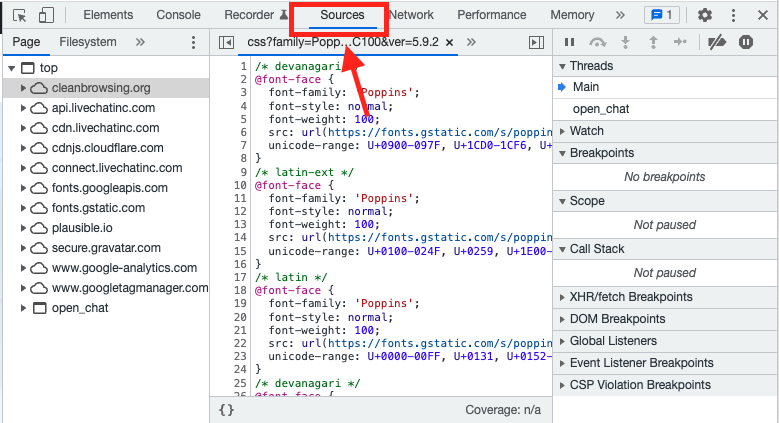
With DevTools open, now we go to work finding any issues that might exist. Navigate to the “sources” tab (shown below):

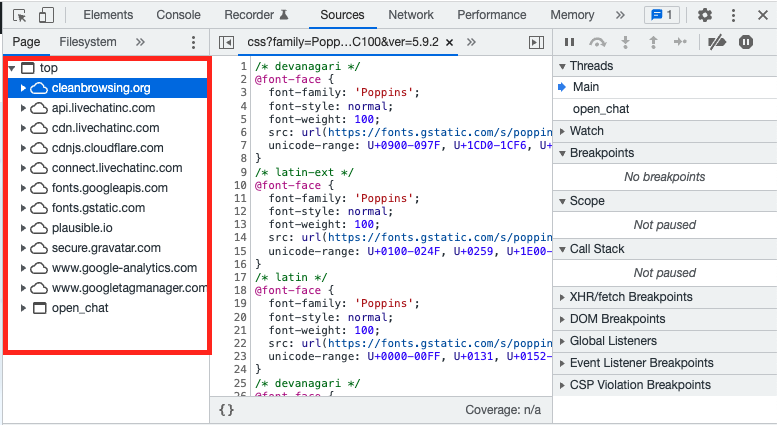
This will show you a list of the domains the site is trying to load (shown below):

The biggest culprit are domains used for Ads & Tracking that have been integrated into the functionality of the site, or CDN’s that have categorized for distributed inappropriate content.
If DNS is the culprit, this is where it will appear. Use this list to update your custom whitelist accordingly.
